Landscaping Statistics show data about the number of landscaping business in U.S., landscaping employment, landscaping companies charges for landscaping services and revenue generated through landscaping projects, top revenue generated landscaping companies and more insights.
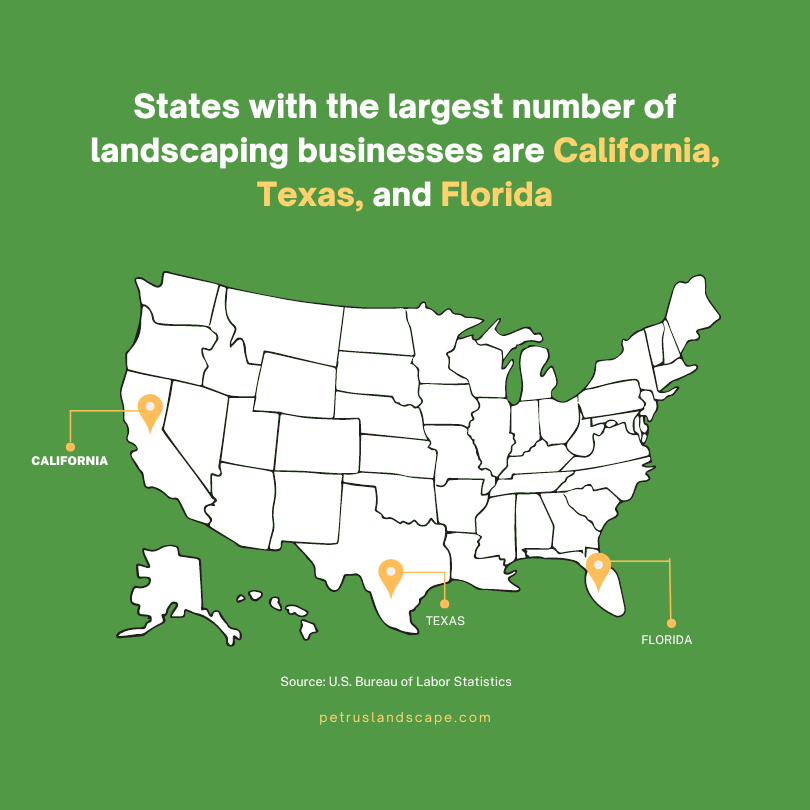
- California, Texas, and Florida are the states with the largest number of landscaping businesses.27
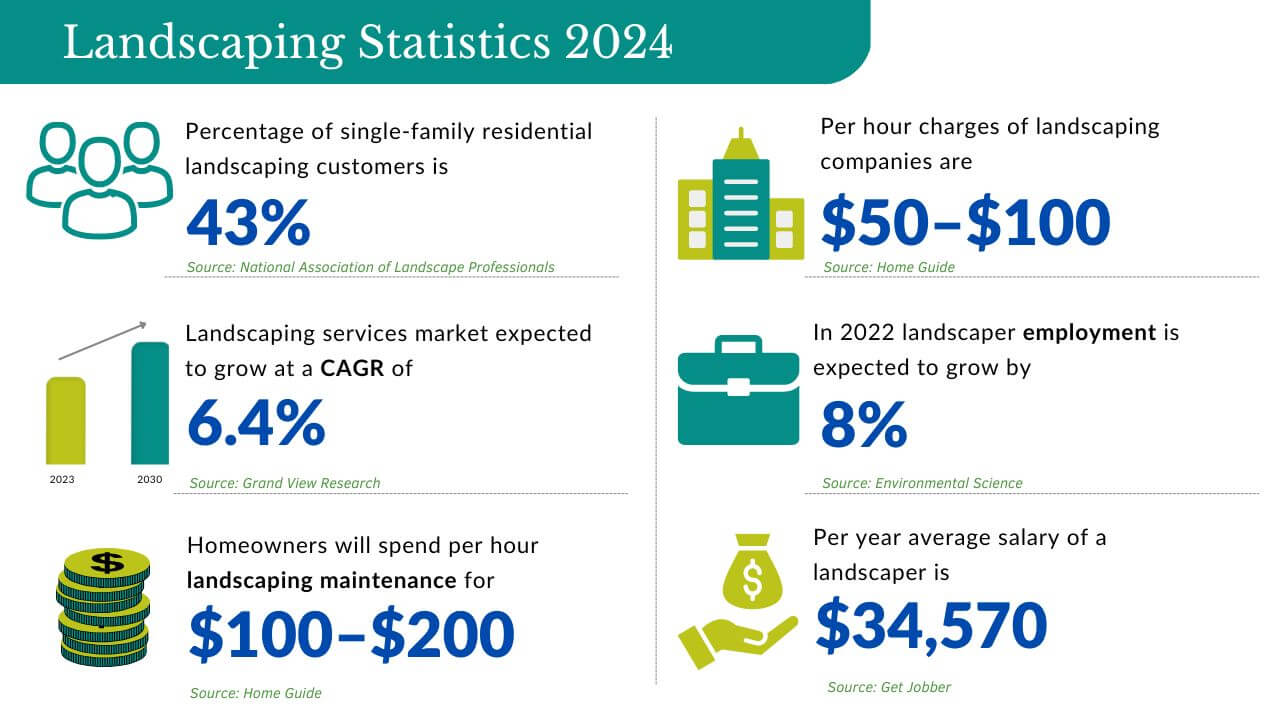
- As of 2022, the global landscaping services market was valued at USD 296.09 billion, and by 2030, it will grow at a CAGR of 6.4%.12
- Landscaper employment is expected to grow 8% from 2020 to 2030.14
- The average salary of a landscaper is $34,570 per year, or $14.62 per hour.7
- 43% of landscaping customers come from single-family residential homes.8
- The biggest consumers in the landscaping service industry are households earning more than $100,000.11
- The average homeowner will spend $100–$200 per month for general landscaping maintenance, lawn care, gardening, and upkeep.29
- On average, landscaping companies charge $50–$100 per hour.29
- Landscaping projects ranges between $2,600 – $13,700 with the average project costing $8,150.3
- The cost to landscape a new house is $3,000 to $15,950 on average, depending on the yard size.19
- In 2023, the Landscape Design industry will remain steady in size.10
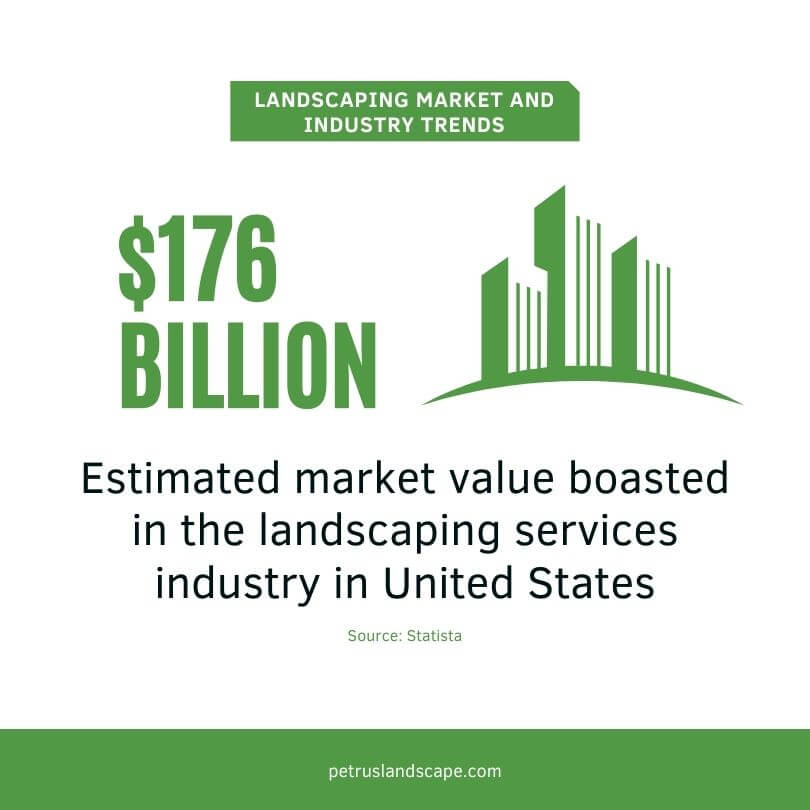
Landscaping Industry and Market Trends
The landscaping market and industry trends provide insights on market value, landscaping industry employment and leading landscaping companies in United States.
- As of 2023, the U.S. landscaping industry employed more than 1.3 million people.32
- In 2023, the landscaping services industry in the United States boasted an estimated market value of around $176 billion.25
- Two of the largest and most populated states, California and Texas, had 33 of the top landscaping companies.13
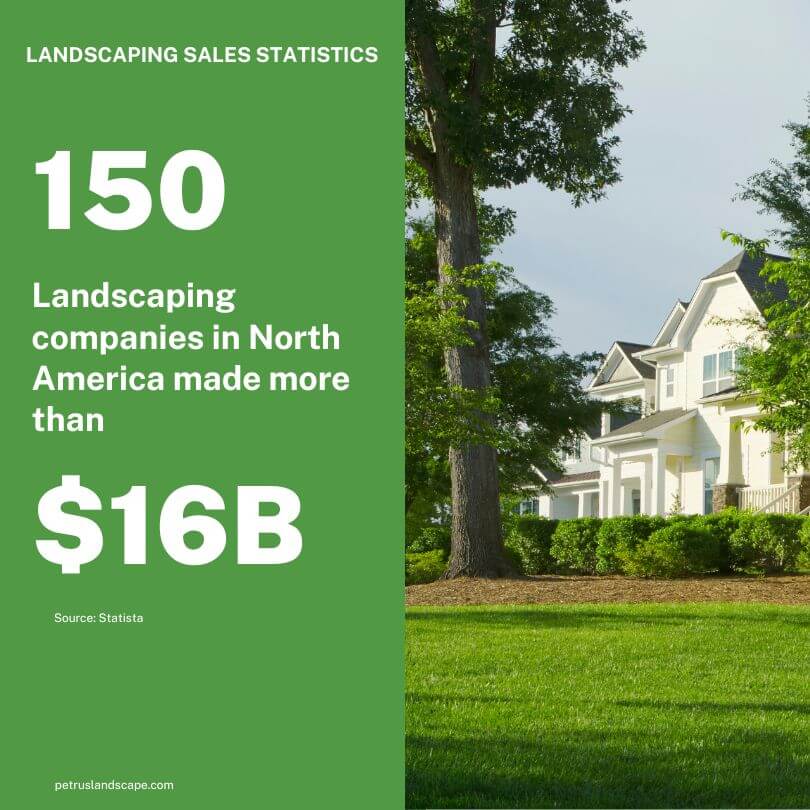
Landscaping Sales Statistics
Landscaping sales statistics provide valuable insights into the economic performance of the landscaping industry, revenue forecast for upcoming years.
- In 2022, the leading 150 landscaping companies in North America made more than 16 billion U.S. dollars in total revenue.26
- In the U.S. the revenue of landscaping services will amount to approximately 100,9 billion U.S. Dollars by 2024.28
Statistics on Landscaping Labor & Demographics
Learn about the diversity and demographics of the labor force driving the landscaping industry.
- California, Florida, and Texas employed the most landscaping workers in 2022.27
- More than 105,000 landscaping workers were working in California in 2022.27
- In the year 2022, Florida had 61,751 landscaping businesses, which is the highest number of any state.34
- District of Columbia,Washington, Massachusetts, Alaska, and Rhode Island were the top-paying locations in 2022 for landscaping workers in the U.S.27
- In the landscaping industry over 91% of landscapers are men while women are 9%.29
Statistics on Time Spent Gardening
This statistics shows the time spent by the individual in gardening and gardening related activity in United states according to the survey from gardeners and homeowners.
- 54.3% of Gen Z and 56.4% of Gen Y respondents expect to spend more time gardening in 2024 compared to 2023.1
- In 2024 71.2% of Gen Z and 76.2% of Gen Y respondents plan to plant more and expand their gardens.1
- In the United States the average homeowner spends 70 hours per year on gardening.2
- As the highest revenue generating company in the United States, BrightView has consistently outperformed its competitors.13
Statistics on Gardening Sales
Gain valuable insights into the economic aspects of the gardening industry, exploring factors like market trends, revenue figures, and the financial impact of gardening-related businesses in U.S.
- Overall, prices for the major vegetables (snap beans, broccoli, carrots, cauliflower, celery, lettuce, onions, potatoes, sweet corn, and tomatoes) rose by 46%.23
- Approximately $47.8 billion is spent by American home gardener on lawn and garden retail sales.15
- There are 5,211 Plant & Flower Growing businesses in the US as of 2023, an increase of 0.2% from 2022.42
- The market is expected to grow at a rate of 2.59% annually from 2024 to 2028 (CAGR 2024-2028).18
- An average household spend of $616 on lawn and garden activities in 2022 is up $74 from 2021 alone.21
Statistics on Types of Gardening
The numbers to discover popular gardening styles and trends followed by gardeners or homeowners in United States.
- Cucumbers and sweet peppers are the second most popular vegetables in food gardening.31
- The most popular types of gardens were in-ground (66.6%) and patio pot/container gardens (39.9%).1
- In 2023, more than one-third of households anticipated increased spending on lawn and gardening products, especially food gardening as compare to 2022.21
Statistics on Gardening Jobs & Industry
Uncover the employment trends, industry growth, and the diverse job roles that contribute to the vibrant tapestry of gardening professions.
- Media is the highest-paying industry for gardeners.16
- Private companies employ 53% of gardeners; education companies employ 30%. The government employs 8% of the workforce, while public companies employ 9%.16
- Garden worker average salary is $27,715 in United States.17
- 27% of high-income households reported gardening interest in 2022, compared to 21% of low-income households.30
- In the U.S., garden workers are most commonly employed by education, manufacturing, and retail industries.17
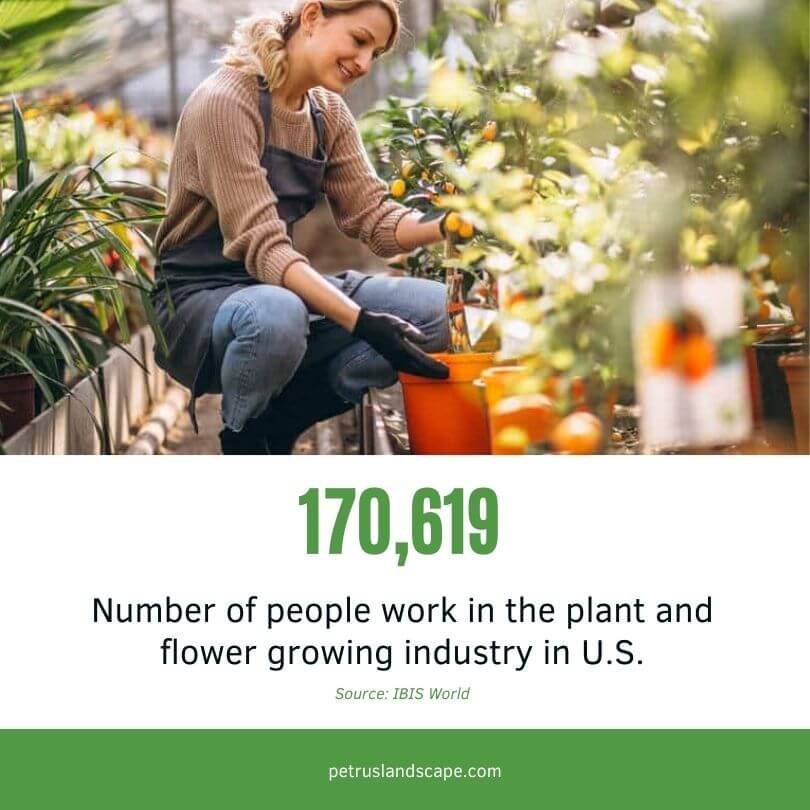
- 170,619 people work in the plant and flower growing industry as of 2023.22
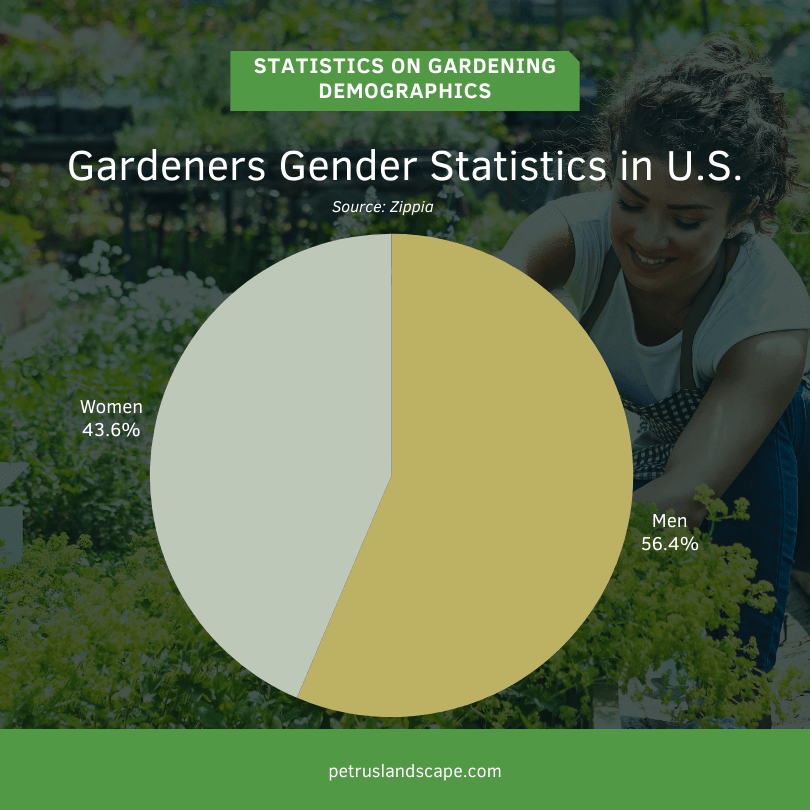
Statistics on Gardening Demographics
Discover insights on gardening demographics based on community, age and gender.
- LGBT individuals make up a mere 3% of the entire gardening community.16
- Out of all gardeners 43.6% are women, while 56.4% are men.16
- The average age of an gardener is 41 years old.16
- Compared to older households, 18-34 and 35-44 year olds saw larger increases in spending.21
Environmental Statistics Gardening
Understand the impact of gardening on the environment through enlightening statistics. Explore how sustainable gardening practices, water conservation efforts, and eco-friendly landscaping choices contribute to a greener world.
- The demand for sustainable and eco-friendly lawn and garden products has increased significantly in the United States.18
- In the fall, initiatives like “Leave the Leaves” have been implemented to reduce landfill waste.20
- Switching from two-cycle gas powered engines to battery operated machinery, including blowers and lawn mowers, helps in reducing carbon emissions.20
- By not cutting back perennials in the fall, habitats for overwintering insects can be created, providing shelter and a food source for insects and animals.20
- A practice known as “rewilding” involves converting portions of lawn into meadows using eco-friendly plantings.20
- The use of peat-free potting soils is encouraged to decrease the demand for peat harvesting, which damages vital wetland habitats for various animals, insects, and plants.20
- Purchasing from brands that prioritize native plants, such as American Beauties, can contribute to backyard biodiversity and reduce the consumption of resources like water and fertilizers.20
As the highest revenue generating company in the United States, BrightView has consistently outperformed its competitors
Statistics on Time Spent Planting
- According to respondents, 45.3% spent 50-100% more time in their gardens in 2023 than in 2022.1
Sales Statistics for Plants
Industry revenue has grown at a CAGR of 3.2% over the past five years, to reach an estimated $19.3bn in 2024.22
- During the pandemic, the average plant parent spent $124.50 on purchasing plants.31
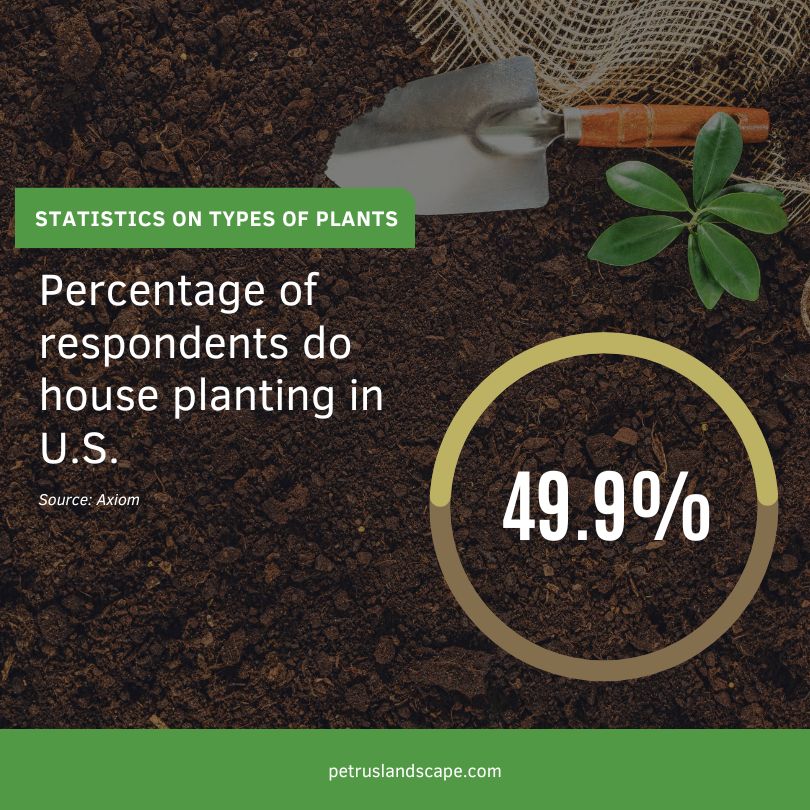
Statistics on Types of Plants
Here are some popular types of plant statistics and trends followed by gardeners or homeowners in United States.
- 76.2% respondents grow more flower plants whereas 55% respondents grow vegetables.1
- 49.9% respondents do house planting.1
- Fiddle Leaf Figs have been identified as the plant with the highest rate of issues based on statistical data.24